
First, my stance:
- Discussing whether technical analysis is useful and whether one can make money through technical analysis are two different matters. Only a fool would rely solely on a single technical analysis.
- Technical analysis trading and quantitative trading are two stuff, and both can be profitable or incur losses. At all times, domain knowledge is the most crucial factor, not the model used.
I spent a bit of time writing a piece of code, and the logic is as follows:
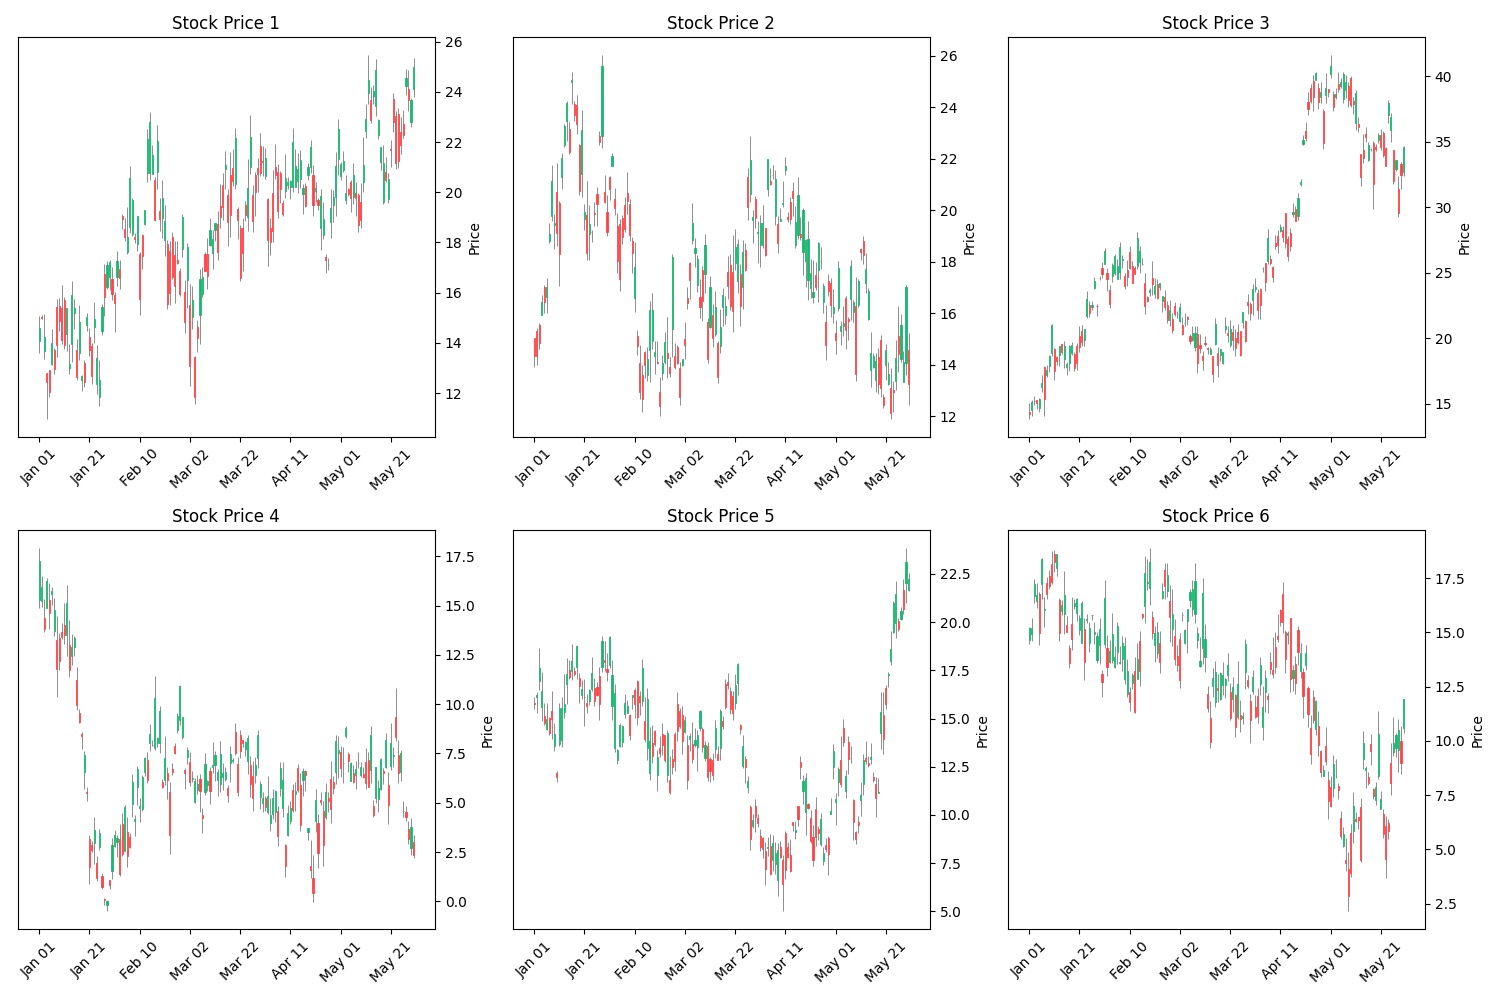
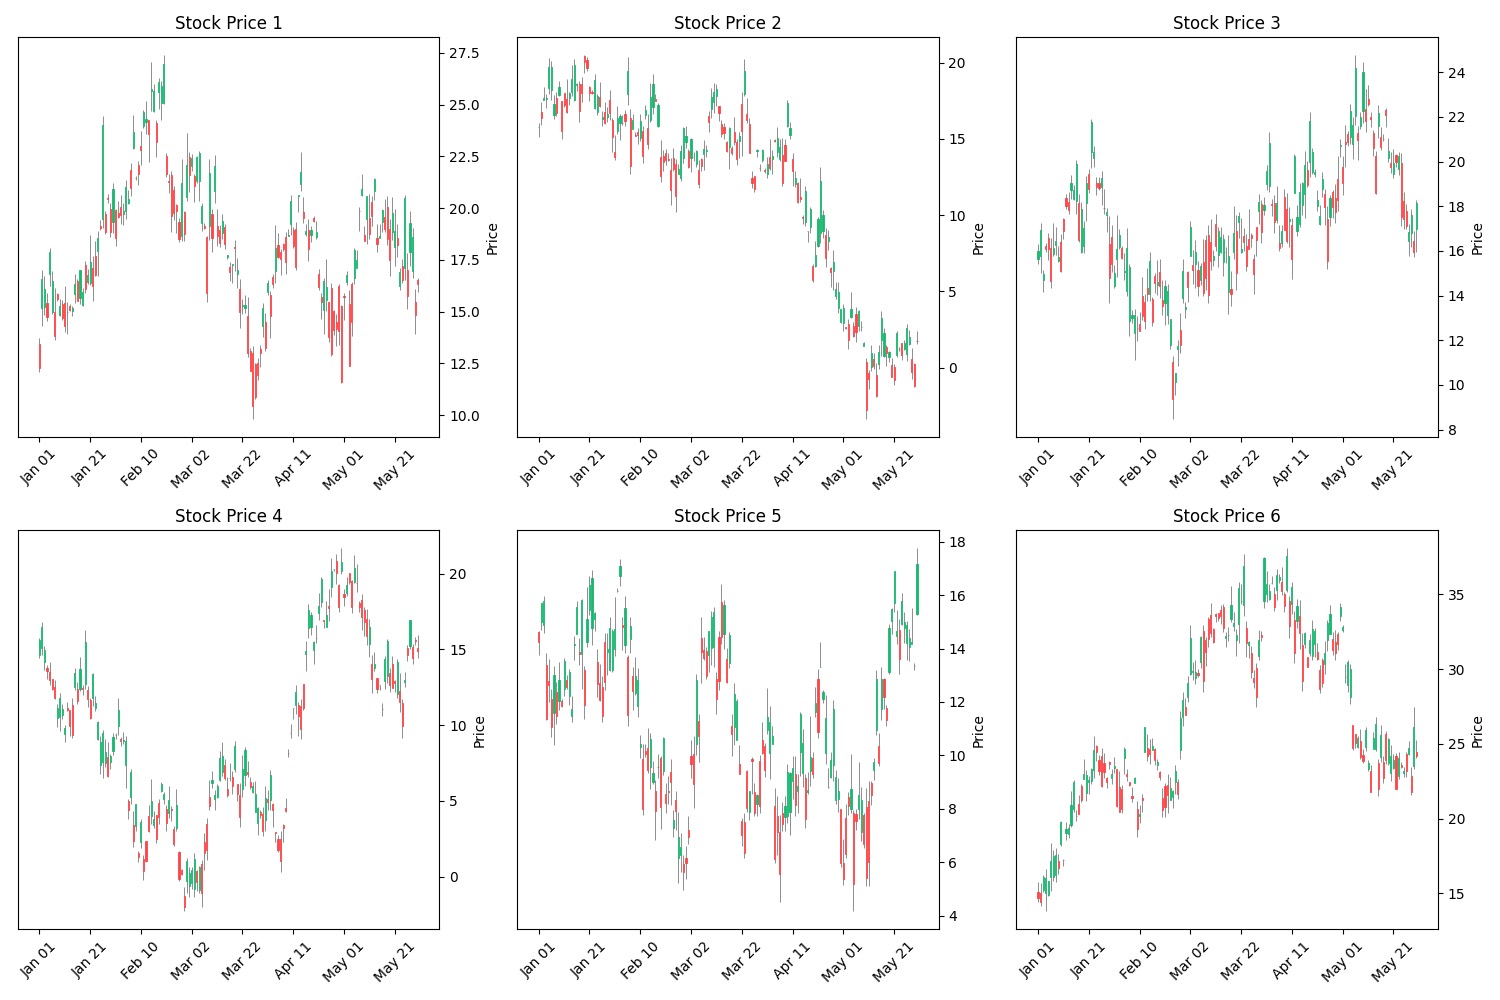
Create a 150-day stock candlestick, where the open_price starts at 15 with a purely random movement (the initial value doesn't matter; what matters is the overall trend). The close_price for the day is open_price + a random number from a standard normal distribution. The next day's open_price is the previous day's open_price + a random number from a standard normal distribution. The highest price for the day is max(close_price, open_price) + the absolute value of a random number from a standard normal distribution divided by 2, and the lowest price is min(close_price, open_price) - the absolute value of a random number from a standard normal distribution divided by 2 (dividing by 2 is just for aesthetics and doesn't affect the closing price for the day).
The code is provided below and can be run to generate results.
Here are 12 randomly generated charts. Do they look similar to actual stock prices? Of course, I'm not well-versed in technical analysis or various theories like Elliott Wave Theory or volume-price analysis. But, in terms of the most basic technical analysis, you can take a look at the randomly generated charts below:
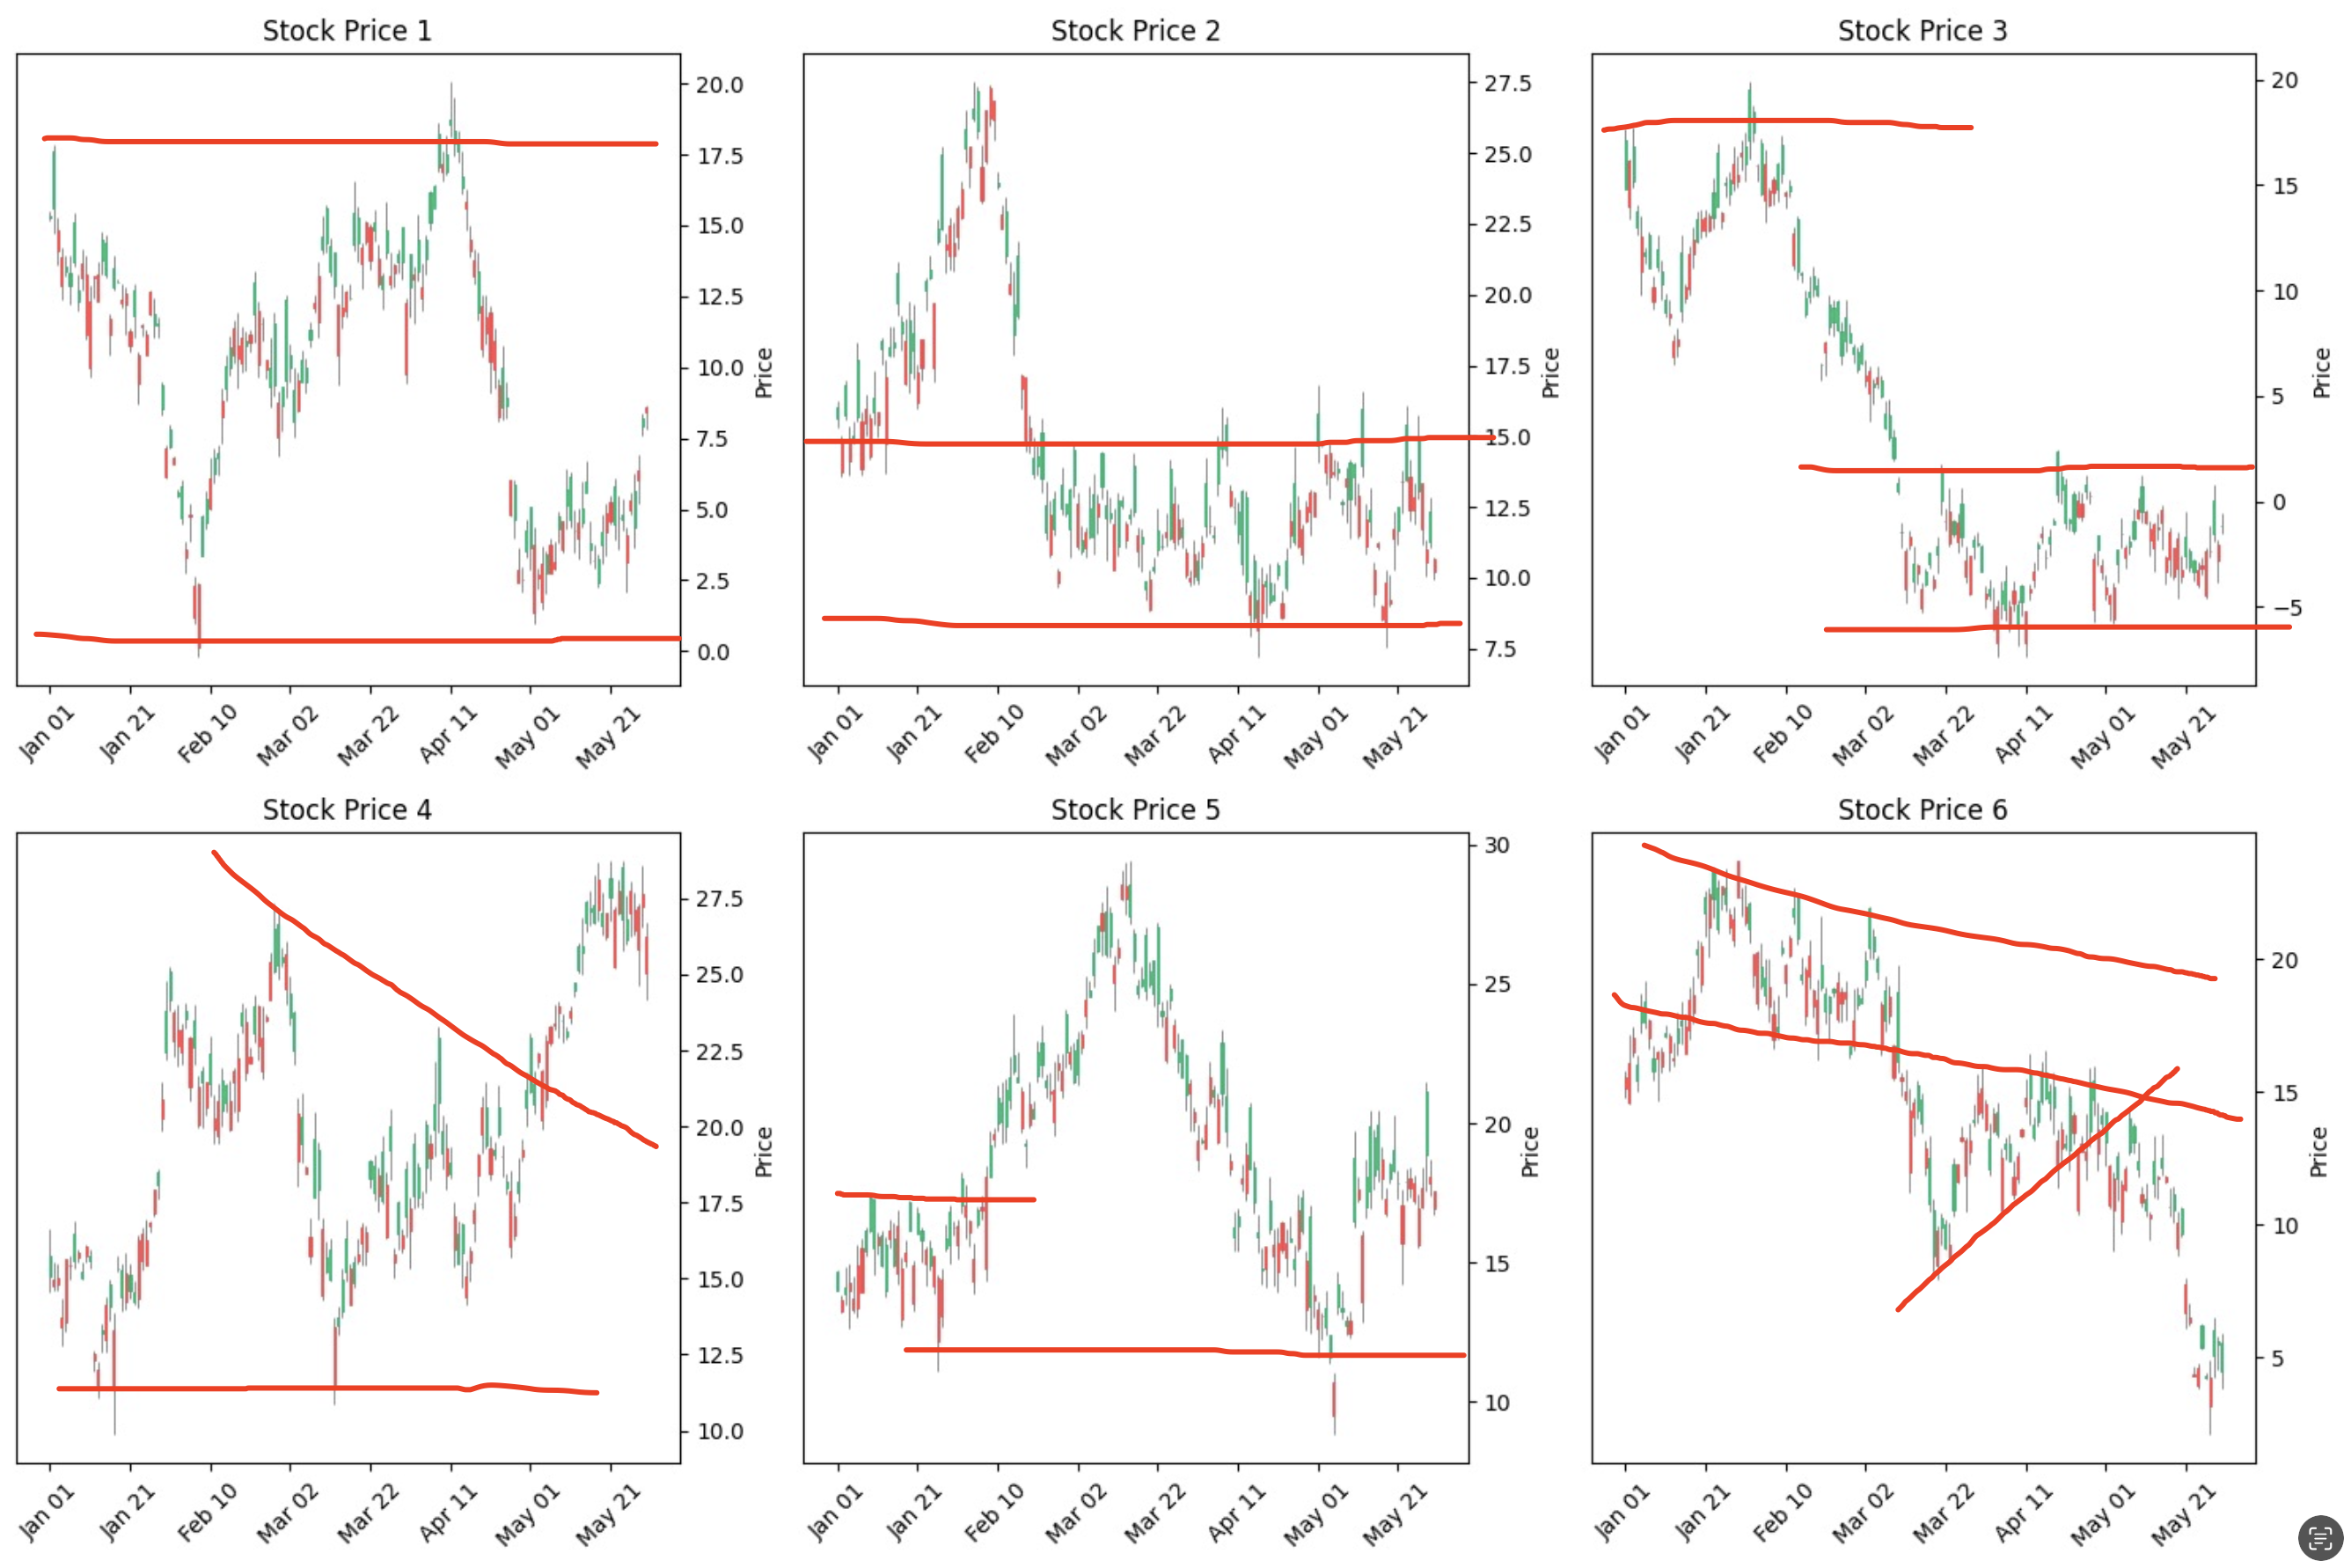
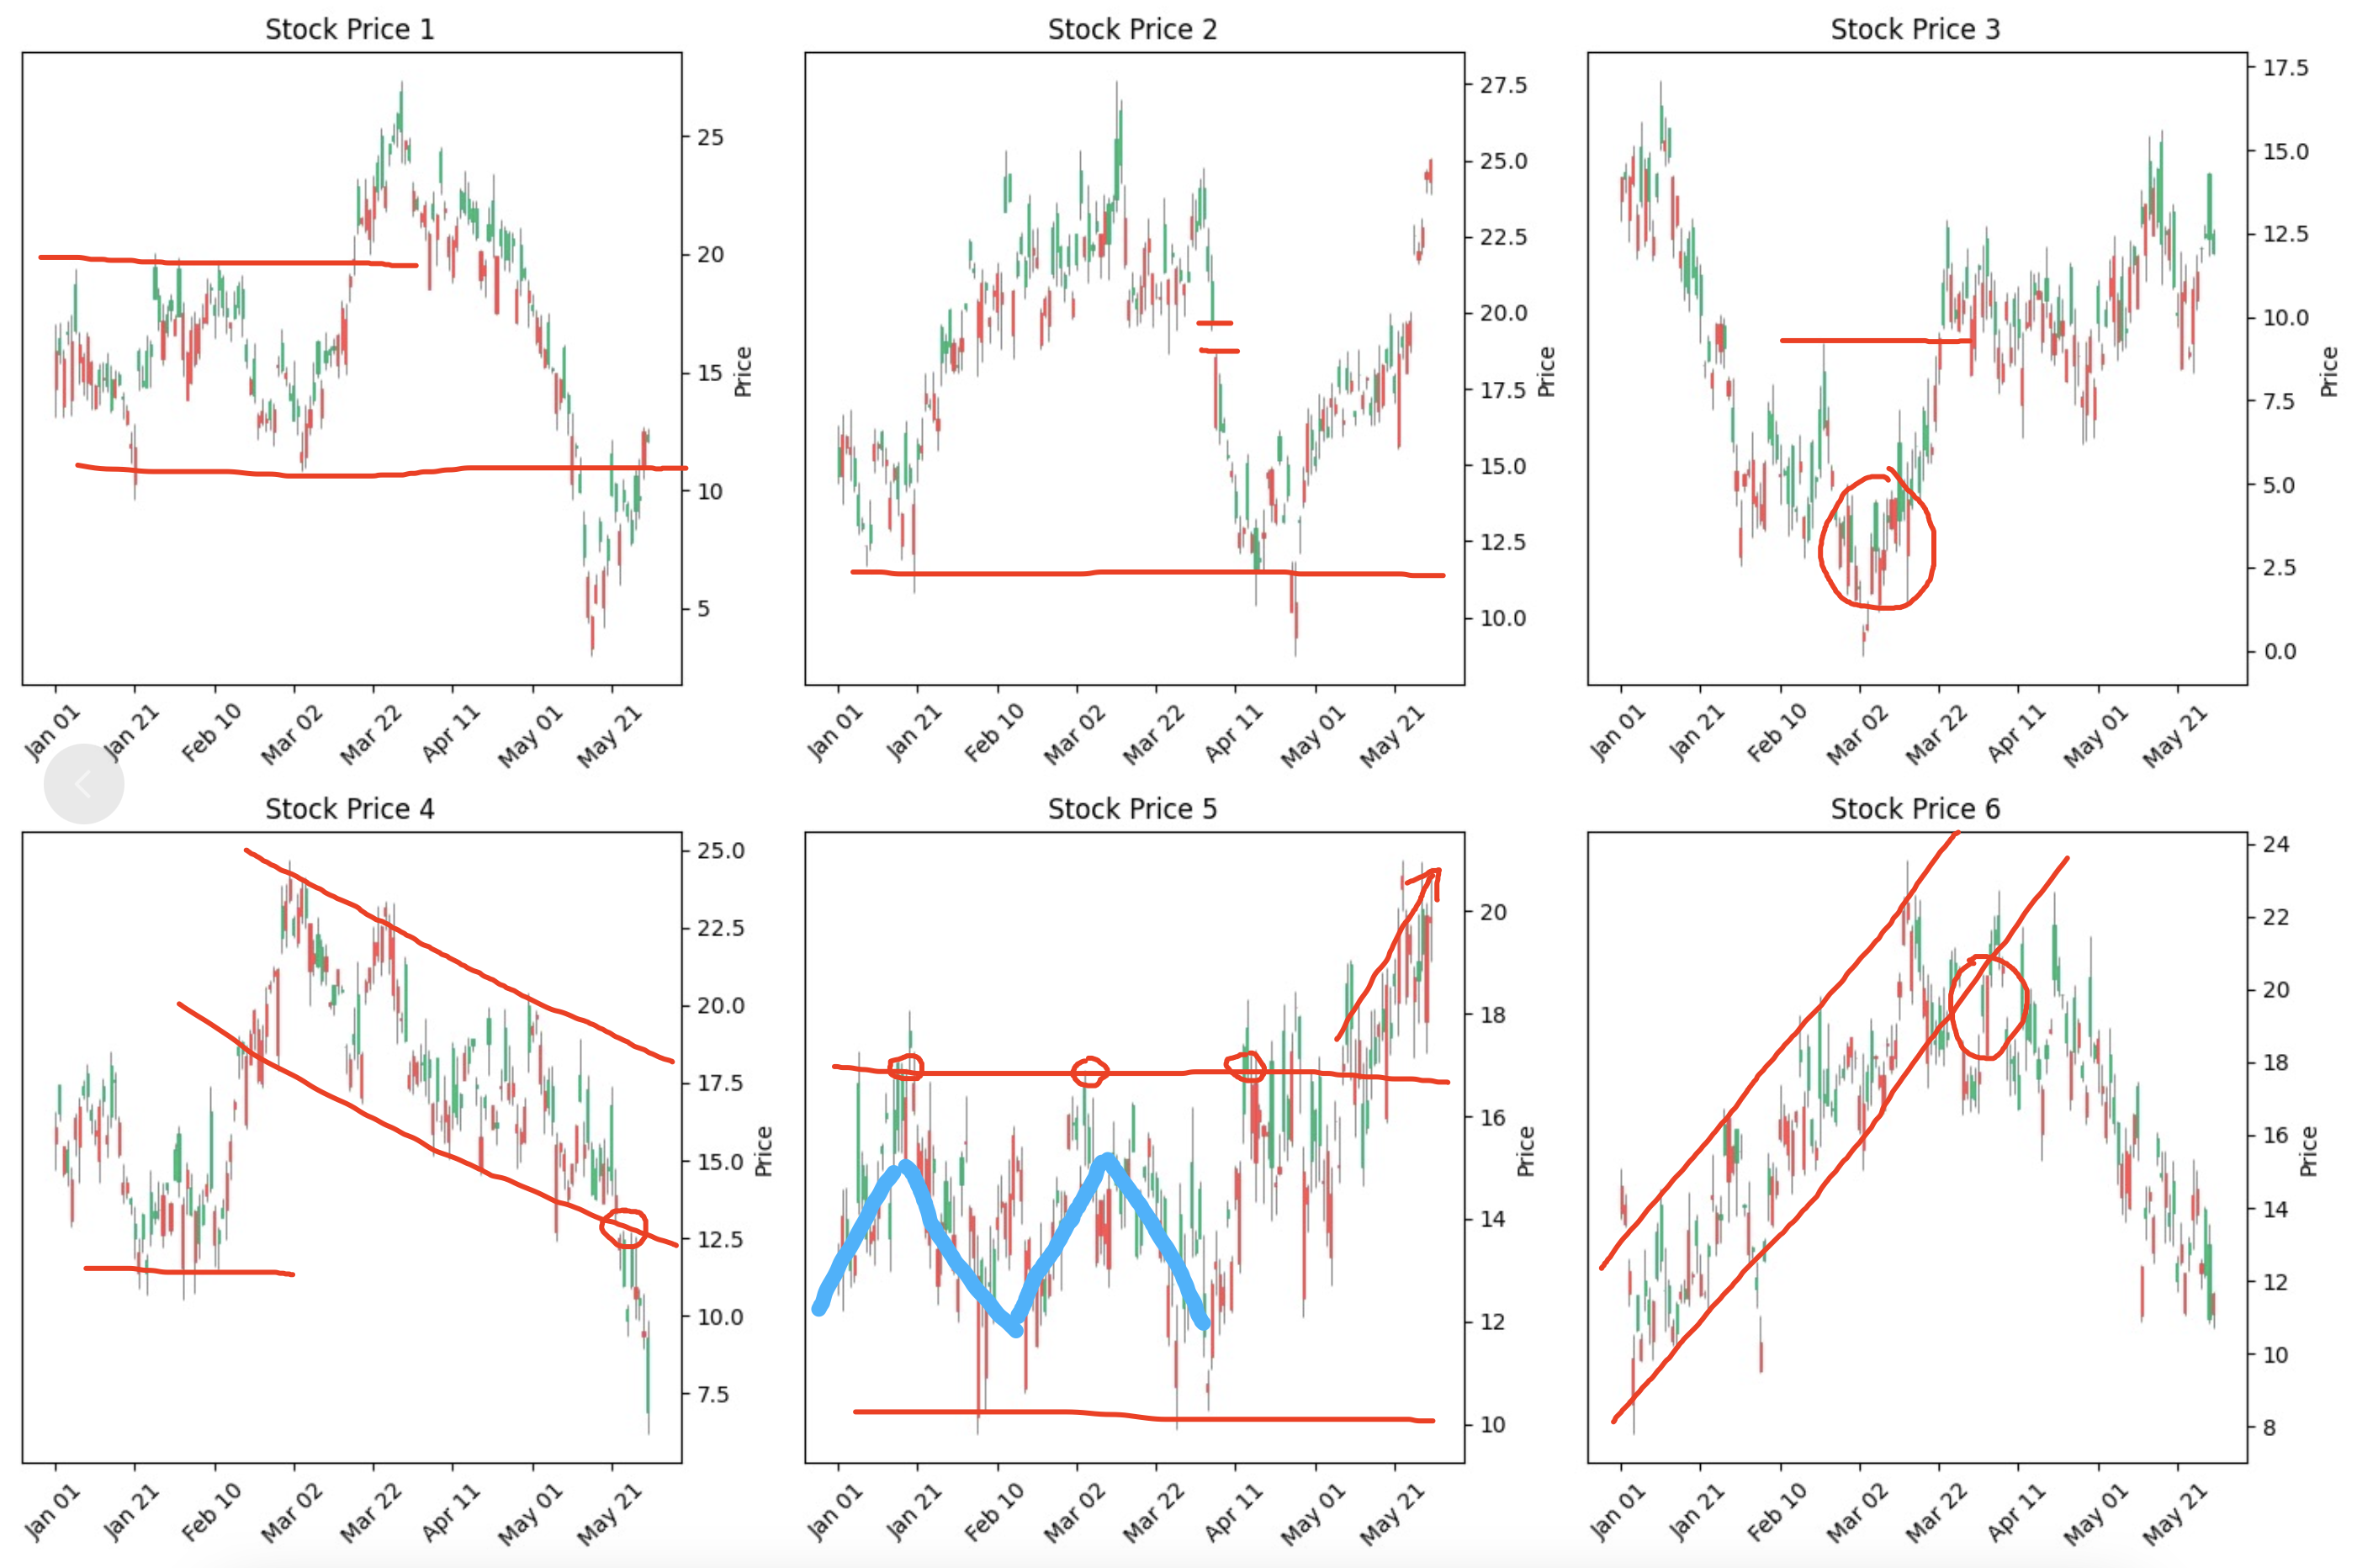
I won't continue drawing more charts, as it should be easy to see:
Of course, this doesn't prove that technical analysis is useless. In my view, these generated images have at least two shortcomings:
- The majority of randomly generated images will not (or have not yet) appear in the actual A-share market. Only a small number of trends in the A-share market align with or resemble the generated charts. This indicates that studying technical analysis should be based on actual trends rather than relying on numerous theoretical patterns to disprove the utility of technical analysis.
- Those who excel at technical analysis will never rely solely on chart patterns. They will inevitably consider trading volume, macroeconomic conditions, policy trends, relative analysis within and outside sectors, etc., to make decisions. Therefore, this is a highly-dimensional fit that cannot be compared to my simplistic one-dimensional data. The lines I drew above don't actually constitute the basis for real trading decisions.
As for comparing discretionary trading and quantitative trading to determine which is better, it's challenging because quantitative trading quantifies everything possible and may include low-weighting for non-quantifiable factors. Discretionary trading is also quantitative but operates on a much higher dimension than quantitative trading. In my limited life experience, I don't believe anyone can create a model superior to human brain intuition. Even if computational power is sufficient, quantifying several thousand dimensions is still a challenge (commonly referred to as "gut feeling" by humans). The human brain's flaws include forgetting things and being overly influenced by external information. However, I absolutely believe there are manual traders in the market who can almost achieve consistent profits. I've experienced it myself; those individuals just can't scale up because when there's too much money involved, it's no longer theirs.
import mplfinance as mpf
import pandas as pd
import numpy as np
import matplotlib.pyplot as plt

def generate_stock_prices(num_of_days, mean, std_dev):
    open_price = [15]
    close_price = []
    high_price = []
    low_price = []

    for i in range(num_of_days):
        # Brownian motion for open price
        open_price.append(open_price[-1] + np.random.normal(mean, std_dev))
        close_price.append(open_price[-1] + np.random.normal(mean, std_dev))
        high_price.append(max(open_price[-1], close_price[-1]) + abs(np.random.normal(mean, std_dev)) / 2)
        low_price.append(min(open_price[-1], close_price[-1]) - abs(np.random.normal(mean, std_dev)) / 2)

    open_price.pop(0)

    dates = pd.date_range('2023-01-01', periods=num_of_days)
    data = {
        'Open': open_price,
        'Close': close_price,
        'High': high_price,
        'Low': low_price
    }
    df = pd.DataFrame(data, index=dates)

    return df

if __name__ == '__main__':
    num_of_days = 150
    mean = 0
    std_dev = 1

    stock_prices = [generate_stock_prices(num_of_days, mean, std_dev) for _ in range(6)]

    fig, axs = plt.subplots(2, 3, figsize=(15, 10))

    for i, ax in enumerate(axs.flatten()):
        mpf.plot(stock_prices[i], type='candle', style='yahoo', ax=ax)
        ax.set_title(f'Stock Price {i+1}')

    plt.tight_layout()
    plt.show()